The National Program for Quality Indicators in Community Healthcare aims to provide the public and policymakers with information on the quality of medical care provided by health plans (kupot cholim) in various fields, with the aim of improving the medical services provided to Israeli residents. To achieve this goal, the program annually publishes national-level results for a series of quality indicators of community healthcare. This monitoring enables the assessment of trends in care quality over time and helps identify areas requiring intervention and improvement, both in information systems and data collection, as well as in the delivery of healthcare services.
Starting in 2023, a Health Disparities Report was published for the first time as part of the National Health Disparities Program. The report, which is based on data from 2021, presents trends in selected indicators by socioeconomic status and by district of residence.
The program’s measures are divided into nine categories and are carefully selected, based on expertise and international literature, in consultation with clinical expert teams, and through consensus among health fund representatives in the program’s steering committee. The calculation of the measures undergoes rigorous internal and external quality control processes.
The National Program for Quality Indicators for Community Medicine publishes data each year that allows for the examination of compliance with quality indicators in a particular year, as well as the assessment of gaps by gender, age, socioeconomic status, and region.
The year 2024, a year of struggle that brings with it challenges and struggles for both medical teams and insured people. This year, negative and positive trends were observed in quality indicators.
The upward trend in adult obesity continued and worsening diabetes imbalances were observed. In addition, influenza vaccination rates among at-risk populations and the elderly remained low.
However, despite the many difficulties, a number of positive and encouraging trends were observed. There was an increase in cancer coverage and a reduction in social gaps, an improvement in the treatment rate after a hip fracture was reported, a continued increase in the treatment rate for diabetic patients with kidney damage, and an increase in cholesterol balance in heart disease patients was observed. All data is published on the website and can be viewed, and the main findings are summarized in the annual presentation.
2024 Health Disparities Indicators
The new 2024 data include follow-up data from the 2023 report and, for the first time, present data on the availability and geographic distribution of selected community healthcare services.
Key Findings:
Cancer Screening:
Increased performance of mammography and colorectal cancer screening in the Arab population and among individuals of low socioeconomic status. Increased performance of cervical cancer screening across all population groups and socioeconomic strata.
Increased performance of colonoscopy following a positive fecal occult blood test, particularly among individuals in the lowest socioeconomic status group and within the Arab and ultra-Orthodox Jewish populations.
Children and Adolescents
Among toddlers, the highest prevalence of anemia was observed in the ultra-Orthodox Jewish population, even after adjusting for the lower rates of hemoglobin testing.
An increase in obesity was observed among 7-year-olds in the lowest socioeconomic status group, with higher rates of both underweight and obesity also observed in the Arab population. Among 14–15-year-olds, underweight was most prevalent in the ultra-Orthodox Jewish population, while obesity was particularly prominent in the Arab population.
The prevalence of diabetes among children has increased since 2020 in the lowest socioeconomic status group and decreased in the highest socioeconomic status group, with the highest diabetes rates observed among children from the Arab population.
An increase in pediatric diabetes clinic visit rates was observed among children in the lowest socioeconomic status group and among the Arab population.
A decrease in poor glycemic control was observed across all socioeconomic groups. Nevertheless, poor glycemic control in the lowest socioeconomic status group was 14 times higher compared with the highest socioeconomic status group, and 3.4 times higher among children from the Arab population compared with the general population.
Diabetes
Diabetes prevalence rates in the Arab population are 30% higher than those in the rest of the population.
The rate of treatment with SGLT-2 inhibitors and/or GLP-1 receptor agonists among adults with diabetes aged 18–84 years with kidney impairment continues to increase across all population groups, with minimal disparities between the different groups.
Accessibility of Healthcare:
The accessibility of healthcare services per 100,000 residents varies across districts and areas of medicine:
Gastroenterologist availability is highest in the central region and is consistent with the observed rates of colonoscopy following a positive fecal occult blood test.
he availability of mammography facilities is higher in the Northern and Southern districts (per 100,000 women aged 50–74), while the availability of colonoscopy facilities is higher in the Central region (per 100,000 residents aged 50–74)
The highest availability of gynecologists was observed in the Judea and Samaria, Kinneret, Golan, and Tel Aviv districts, whereas the lowest availability was observed in the Ashkelon, Rehovot, Acre, and Holon districts.
The highest availability of orthopedists per 100,000 residents was observed in the Tel Aviv, Kinneret, Golan, and Haifa districts, whereas the lowest availability was observed in the Jerusalem, Acre, and Judea and Samaria districts.
All data are available in the presentation and will be included shortly in the Health Disparities Report.
The National Program for Quality Indicators for Community Medicine publishes data each year that allows for the examination of compliance with quality indicators in a particular year, as well as the assessment of gaps by gender, age, socioeconomic status, and region.
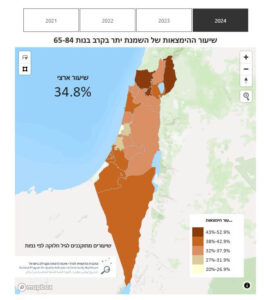
Following the events of October 7th, and the Iron Swords War, starting in 2023, the production of the program’s indicators includes the Western Negev cluster as a separate region. The rates by residential district can be seen on the maps’ publications page or in the annual presentation.
In the near future, we will publish a Health Disparities Report for 2022-2023, which will examine changes in rates of performance on the measures over time, gaps by population group (Arab, Haredi, and other), and for the first time, a regional analysis including separate figures for the Gaza Envelope.
Selected quality indicators are presented in a geographical segmentation into 20 districts according to the insured’s residential address. The maps can be viewed in various areas and by choice here.